
Most people assume Dubai outperforms Madrid in every metric and Madrid only wins on safety. The numbers tell a more nuanced story. Over the last 4 years both cities have created wealth, but through very different engines: Dubai’s surge has been driven by immigration and company set‑ups, flexible off‑plan payment plans, strong launch volumes, and very light taxes and fees that keep net returns high. Madrid’s climb has come from steady end‑user absorption, job growth and inward migration, limited new supply because of permitting and heritage constraints, a tight rental market, and stricter but predictable rules that anchor confidence.
In this article we compare both markets in a practical way, separating two strategies: buy to rent and buy to flip. We will also set a simple framework to compare entry costs, taxes, liquidity and yields by neighborhood, then run a like for like case with the same budget and line item math in Chamberí and Business Bay. The result may surprise you.
Market Evolution Over the Last 4 Years
Madrid
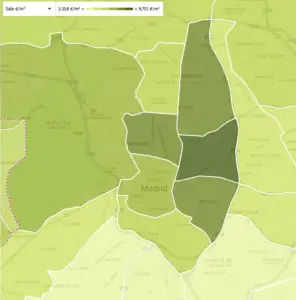
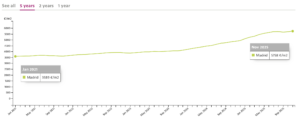
Madrid’s residential market delivered steady gains rather than explosive spikes. After the 2020 pause, prime districts like Salamanca, Chamberí, and Chamartín rebounded first, followed by Centro and Retiro. Up‑and‑coming areas such as Tetuán (Castillejos/Cuatro Caminos), Arganzuela (Delicias/Palos de Moguer), and new‑build hubs like Valdebebas and Méndez Álvaro also moved upward as buyers searched for value. The overall city picture since late 2020 has been a solid 30–40 percent appreciation, with prime addresses leading and peripheral districts showing more moderate but consistent growth.
Dubai

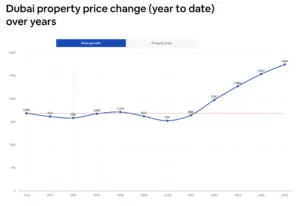
Dubai shifted from a 2019–2020 correction to one of the strongest runs globally. Palm Jumeirah and Dubai Hills posted standout jumps, with Downtown Dubai and Business Bay recovering sharply, while investment zones like Jumeirah Village Circle (JVC) and Jumeirah Lake Towers (JLT) attracted yield‑seekers. From 2021 to 2024, the broad market climbed ~60–80 percent in nominal terms, powered by international inflows, a business‑friendly environment, and a benign tax regime.
Takeaway: Dubai sprinted; Madrid jogged. Both created wealth, but the slope of the curve has been far steeper in Dubai.
Average price per m² in the last 4 years
Citywide averages. Rounded. Dubai values converted to €/m² from AED per sq ft using 1 AED ≈ €0.25 and 1 m² = 10.7639 sq ft.
| Year | Madrid €/m² | Dubai €/m² (approx) |
| 2022 | €4,400 | €2,826 |
| 2023 | €4,900 | €3,364 |
| 2024 | €5,300 | €3,902 |
| 2025 | €5,750 | €4,306 |
Rental Yields and Strategy Fit (Rent vs Flip)
Quick primer: yields hinge on micro location, unit type, and cost drag. Madrid usually offers lower gross yields with strong end‑user demand. Dubai often delivers higher income, but you must watch service charges and short‑stay supply. Below we break down buy‑to‑rent vs flip, and short‑term vs long‑term.
Buy‑to‑Rent
- Madrid: Gross yields typically 3–5 percent depending on micro‑location and unit condition. Examples: Salamanca/Recoletos 2.8–3.8 percent, Chamberí 3.2–4.2 percent, Tetuán 4–5 percent (higher in walk‑ups to refurbish). After community fees, IBI (property tax), insurance, and maintenance, net yields compress notably.
- Dubai: Gross yields often 6–8 percent. Examples: Business Bay 6–7 percent, Dubai Marina 6–7 percent, JVC 7–8 percent. After service charges and minor operating costs, net yields remain attractive because there’s no personal tax on residential rental income.
Short‑Term vs Long‑Term Rentals
- Madrid: Short‑term is heavily regulated in the center; most investors default to standard long‑term leases. Long‑term demand is deep in Universidad/Malasana, Goya, Lista, Atocha/Embajadores.
- Dubai: Holiday homes work in Marina, JBR, Downtown, but long‑term lets have been more stable recently as short‑stay supply increased. Many investors now prioritize annual leases for predictability.
Flipping (Buy, Renovate, Sell)
- Madrid: Possible but tight margins. Between transaction taxes, renovation costs, and capital‑gains tax, you need meaningful value creation (design, layout optimization, terraces, parking) in prime or semi‑prime to justify the risk.
- Dubai: Flipping has been lucrative in this cycle, especially off‑plan (assignments after milestone payments). With no capital‑gains tax and low transaction friction, double‑digit IRRs have been common in fast‑rising districts. Cyclicality is higher, so timing and developer selection matter.
Taxes and Transaction Costs: Concrete Examples
This is one of the biggest differences between both cities. Beyond price trends, the real impact shows up in entry and exit frictions that reshape your net yield. Spain loads costs at the front with transfer tax (ITP or VAT), stamp duty (AJD), and notary and registry fees, then taxes rental profit and capital gains when you sell. Dubai concentrates most of the hit at purchase with the DLD 4 percent fee plus an agency commission and keeps ongoing tax drag close to zero for residential. Below you will find like‑for‑like €500k cases so you can see the gap in euros, not theory.
Madrid — Resale purchase at €500,000 (no mortgage)
- ITP (transfer tax): typically 6–10 percent depending on the region. In the Community of Madrid, investors often model ~6–7 percent → €30,000–€35,000.
- Notary + Land Registry + gestoría: usually 0.5–1 percent → €2,500–€5,000.
- Agent fee: commonly paid by the seller in Madrid, but buyers may face 1–3 percent in some private deals.
- Annual costs: IBI (municipal property tax), community fees, insurance, maintenance.
- Exit taxes: Personal capital‑gains tax on profit (savings scale bands; think roughly 19–28 percent effective on gains), plus possible municipal “plusvalía” depending on cadastral values and tenure.
Madrid — New build at €500,000 (first delivery)
- VAT (IVA): 10 percent → €50,000.
- AJD (stamp duty on deeds): region‑dependent; model ~0.5–1.5 percent.
- Notary/Registry/gestoría: 0.5–1 percent.
- Annual/exit: similar to above, plus capital‑gains on sale.
Dubai — Completed unit at ~€500,000 (≈ AED 2.0m)
- Dubai Land Department (DLD) fee: 4 percent of price → €20,000.
- Agent commission: typically ~2 percent → €10,000.
- Admin/NOC/registration: a few hundred to a few thousand dirhams.
- Service charges: building‑dependent; plan AED 12–30 per sq ft/year for apartments in Marina/Downtown/Business Bay; villas vary by community amenities.
- Income/capital‑gains tax: not applied to residential rents or resale gains under current rules.
Dubai — Off‑plan purchase
- Oqood/registration: generally 4 percent of the original price payable during the schedule.
- Payment plan: milestone‑based with post‑handover options in some cases.
- Flip via assignment: often allowed after a percentage of payments; check the SPA for conditions.
Why this matters: On a like‑for‑like €500k deal, entry friction in Madrid can easily exceed €35–55k, vs ~€30–35k in Dubai including agency. The ongoing tax drag in Madrid (rents and gains) further widens the net return gap.
What You Can Buy With the Same Budget
Before the numbers, here is a quick street‑level snapshot of what the same ticket buys in each city. Use it as a compass to set expectations on space, building quality and likely yields by micro‑location, then dive into the detailed math below.
€300,000
- Madrid: 1‑bed Centro or Chamberi (interior without views) or compact 2‑bed in Tetuán / Usera, or a larger unit in peripheral districts; yields improve outside prime.

- Dubai: Modern studio in Downtown/Marina or 1‑bed in JVC/JLT/Business Bay with higher gross yields.

€500,000
- Madrid: Quality 2‑bed in Chamberí (Ríos Rosas) or Retiro (Ibiza/Estrella); 3‑bed family unit in Hortaleza/Valdebebas.
- Dubai: 2‑bed in Business Bay/Marina or townhouses in Dubai South / Mudon depending on stage and finish.

€1,000,000
- Madrid: Prime 3‑bed in Salamanca (Recoletos/Castellana) or Chamartín (El Viso/Nueva España).
- Dubai: Large 3‑bed with views in Downtown/Marina or a villa in Dubai Hills/Arabian Ranches with premium amenities.
Scenario Math: Net Yield vs Flip
Madrid — Long‑term rent on €500k unit in Chamberí
- Gross rent €22,500/year (~4.5 percent).
- Less IBI, community, insurance, light capex €3,000–4,000.
- Net pre‑tax ~3.7–4.0 percent. After personal income tax on rental profit, ~2.6–3.2 percent effective depending on your bracket and deductions.
Dubai — Long‑term rent on ~€500k unit in Business Bay
- Gross rent €35,000–40,000/year (6.5–8 percent typical).
- Service charges €6,000–9,000; other opex modest.
- Net ~5.5–6.5 percent with no income tax drag.
Flip comparison (12–18 months hold), apples to apples
- Refurb + resale in both:
Madrid: Buy €500k resale + ~8 percent friction; refurb €40k; sell €620–650k → after frictions and gains tax, IRR mid single to high single only if you create real value.
Dubai: Buy ~€500k completed + ~6 percent friction; light refurb €15–25k; sell €560–590k → with no capital gains tax and faster resales, IRR high single to low teens if you buy right and manage fees. - Off plan in both:
Madrid: Reserve €500k new build; 10 percent VAT + ~1 percent AJD on completion; typical 20–30 percent during build; exit at delivery €560–590k in prime adjacent schemes → after taxes and resale costs, IRR low single to mid single unless the market outperforms.
Dubai: Launch price €450–500k, 50 percent paid during build; exit near handover €540–580k → minimal tax drag and quicker settlement support low to mid teens IRR in the recent cycle.
Practice: Side‑by‑Side Case Study (2025)
Assumption: Cash purchase of an upper‑mid 2‑bed in Chamberí (Madrid) vs a comparable 2‑bed in Business Bay (Dubai). Ticket €500,000. Conservative rents and costs.
| Item | Madrid (Chamberí) | Dubai (Business Bay) |
|---|---|---|
| Purchase price | €500,000 | €500,000 |
| Entry costs (all‑in) | €40,000 (~8 % ITP+fees) | €30,000–35,000 (DLD 4 % + agent ~2 % + admin) |
| Gross annual rent | €22,500 (4.5 %) | €37,500 (7.5 % mid‑point) |
| Annual running costs | €3,500–4,000 (IBI + community + insurance + minor capex) | €7,000–8,500 (service charges + minor opex) |
| Net pre‑tax yield | ~3.7–4.0 % | ~5.8–6.1 % |
| Taxes on rent | Yes (savings scale, effective often 19–24 % on profit) | No (residential rents not taxed) |
| Typical exit timeline | 3–12 months | Weeks–months depending on community and price band |
| Net after‑tax yield | ~2.6–3.2 % | ~5.8–6.1 % |
- Madrid: +€40k refurb; target exit €630k. After buyer/seller frictions and capital‑gains, IRR mid‑single to high‑single unless you create real premium (terrace, parking, top finish).
- Dubai: Off‑plan launch buy €450k; pay 50 percent during build; exit €560k near handover. After DLD/agent on resale, IRR low‑ to mid‑teens if market momentum holds.
Notes: Numbers are illustrative ranges from recent deals and market norms; actual outcomes vary by building, floor, view, finish and timing.
Conclusion
Over the last four years, Dubai has delivered faster price growth and higher net yields because entry and exit costs are lower and ongoing taxes are lighter. Madrid has been steadier, supported by rule of law, deep end user demand and the stability of the euro.
What does that mean in practice? If you want income and momentum, Dubai is the stronger pick today. If you care more about capital preservation in euros and predictable tenancy, Madrid is the safer choice. If you want to be active and time cycles, Dubai off plan gives you more upside. If you prefer set and forget, Madrid long term rentals are hard to beat.
Investor fit at a glance. Income seeker: overweight Dubai in Business Bay, Marina or JVC with annual leases that net 5.5 to 6.5 %. Euro conservative: overweight Madrid in Chamberí, Retiro or Valdebebas with 3 to 4 % net and low volatility. Growth minded: combine Madrid value add refurbishments with Dubai off plan allocations to target double digit IRRs with controlled risk.
Do not ignore currency and liquidity. Madrid keeps you in euros which reduces FX risk if your life and liabilities are in Europe. Dubai is AED which is pegged to the US dollar. Exits in Madrid often take months. In Dubai smaller tickets in popular communities can move faster. Plan your cash needs before you buy.
Watch the risks that matter. In Dubai monitor new supply, service charges, developer quality and the speed of off plan handovers. In Madrid watch regulatory changes on rentals, time to permit and the tax treatment on gains. Your underwriting should stress test rents, vacancy and exit prices by at least 10 to 15 %.
A simple allocation that works for many. Barbell the two markets. For example 60 % Dubai for cash flow and growth and 40 % Madrid for stability. Or flip the weights if your priority is capital preservation. Ladder entries over 6 to 12 months and split between one long term rental and one value add or off plan position to smooth timing risk.
Clear conclusion. For total return in the current cycle, Dubai wins. For sleep well stability and currency safety, Madrid wins. Many investors will do best by mixing both, using Dubai for growth and cash flow and Madrid for ballast.